
Node
Edge Computing Device
The Renovo Node is an edge computing device capable of storing huge quantities of sensor and driving data collected by autonomous and ADAS vehicles. The unit runs a Linux system that is accessed via a cloud-based front end. Vehicle data can be loaded onto the Node via an optical data cable or by inserting a hard drive into any of 8 drive bays. Once vehicle data has been ingested into the Node, it can execute workloads to help automotive OEMs find data critical to improving their vehicles.
|
|
Background
While a Node is typically accessed remotely via custom cloud software, it also has an iPad mounted on top that serves as a display for tracking the progress of data ingestion. The display UI originally built by engineering (shown below) was functional in that it showed overall ingestion progress, but the sparse display lacked any connection to Renovo's software brand and needed affordances to better communicate the state of the device to an operator. This need, combined with our plan to demonstrate the device at CES 2020 in Las Vegas, required a redesign of the UI, which I was tasked to complete within a short timeframe.
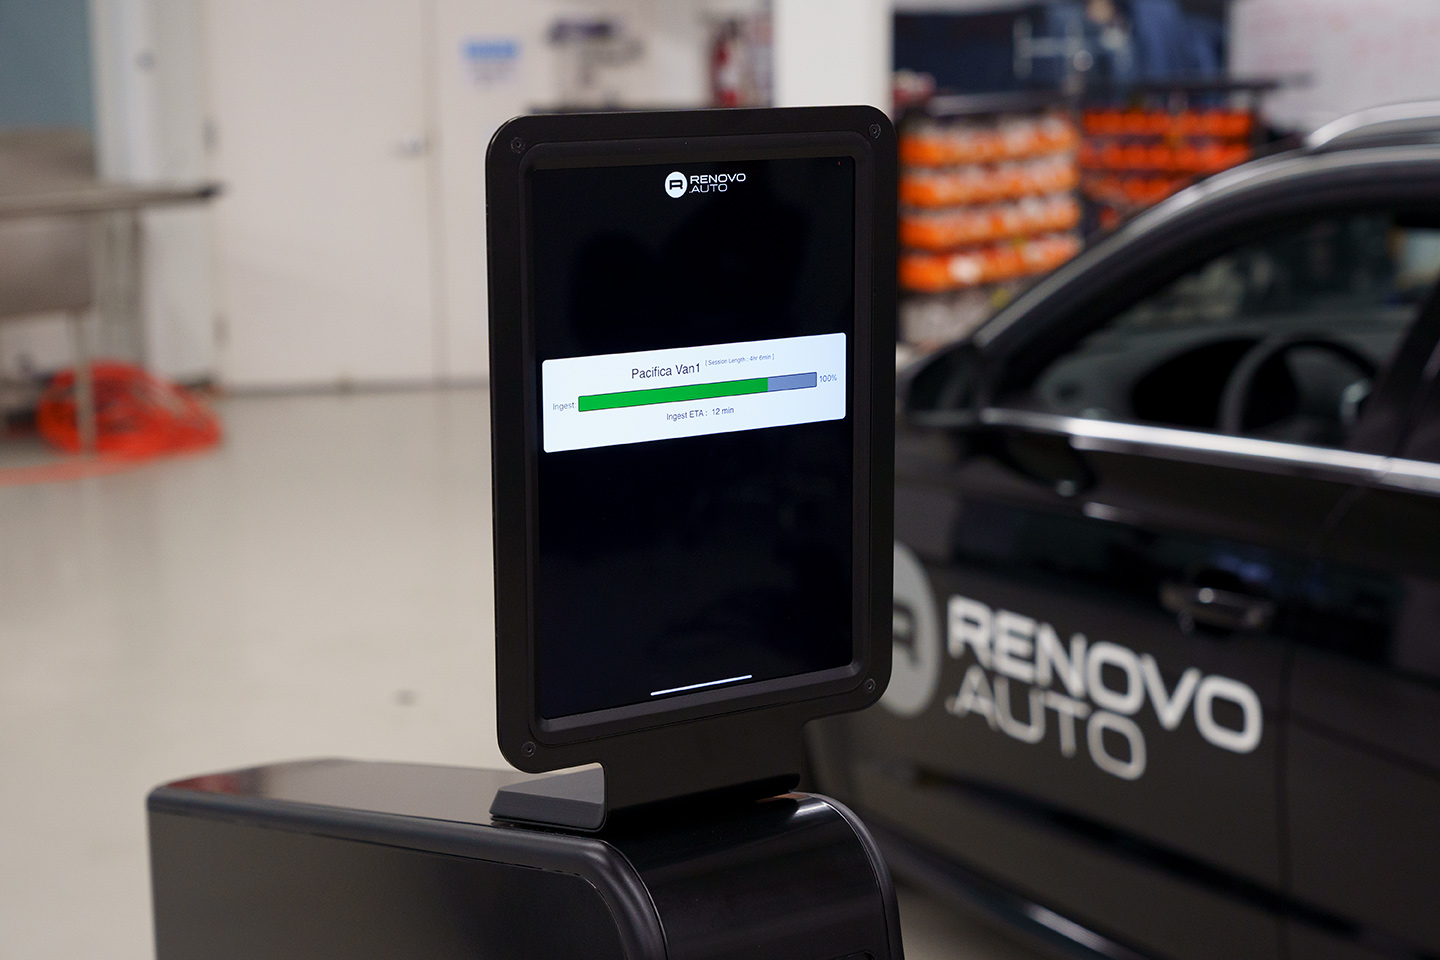
Original Progress Screen
When considering the needs of a system operator and the typical operating environment (a garage or shop), it occurred to me that it would be useful to be able discern details of an ingestion when standing some distance from the display, and this same need could be attributed to show attendees. A data ingestion session will often take several hours, so the display of a slow-moving progress bar on its own is not especially helpful in determining operating status.
I increased the size of the transfer/time metrics, and incorporated a chasing-arrow animation (also used in the design of our cloud software) to help visually reinforce device operation. I also opted to change the progress bar to a radial indicator to make better use of the screen real estate and, again, increase progress visibility from a distance. The design modifications incorporated the brand and visual style established in our front end software.

Revised Layout
To provide a more complete user experience, I created a login/splash screen, indicators for the drive bays to show drive status, and large easy-to-press controls to trigger the ingestion session.

Login & Setup
As the show deadline neared, along with an expectation of a constantly moving crowd, we decided to simplify the implementation and use a looping demonstration ingestion on the screen to more quickly communicate the behavior of the device. As our Nodes would be running in two separate booths with two different vehicles, I built two standalone prototypes using Protopie to run on each device. The following is a capture of the final show implementation.
An additional detail our team implemented was to bind an LED string with a custom chase pattern and color to the data cable to help communicate the data transfer concept to booth visitors. While cosmetic in nature, the resulting effect color-coordinated each Node with its surroundings and made for a dramatic presentation.
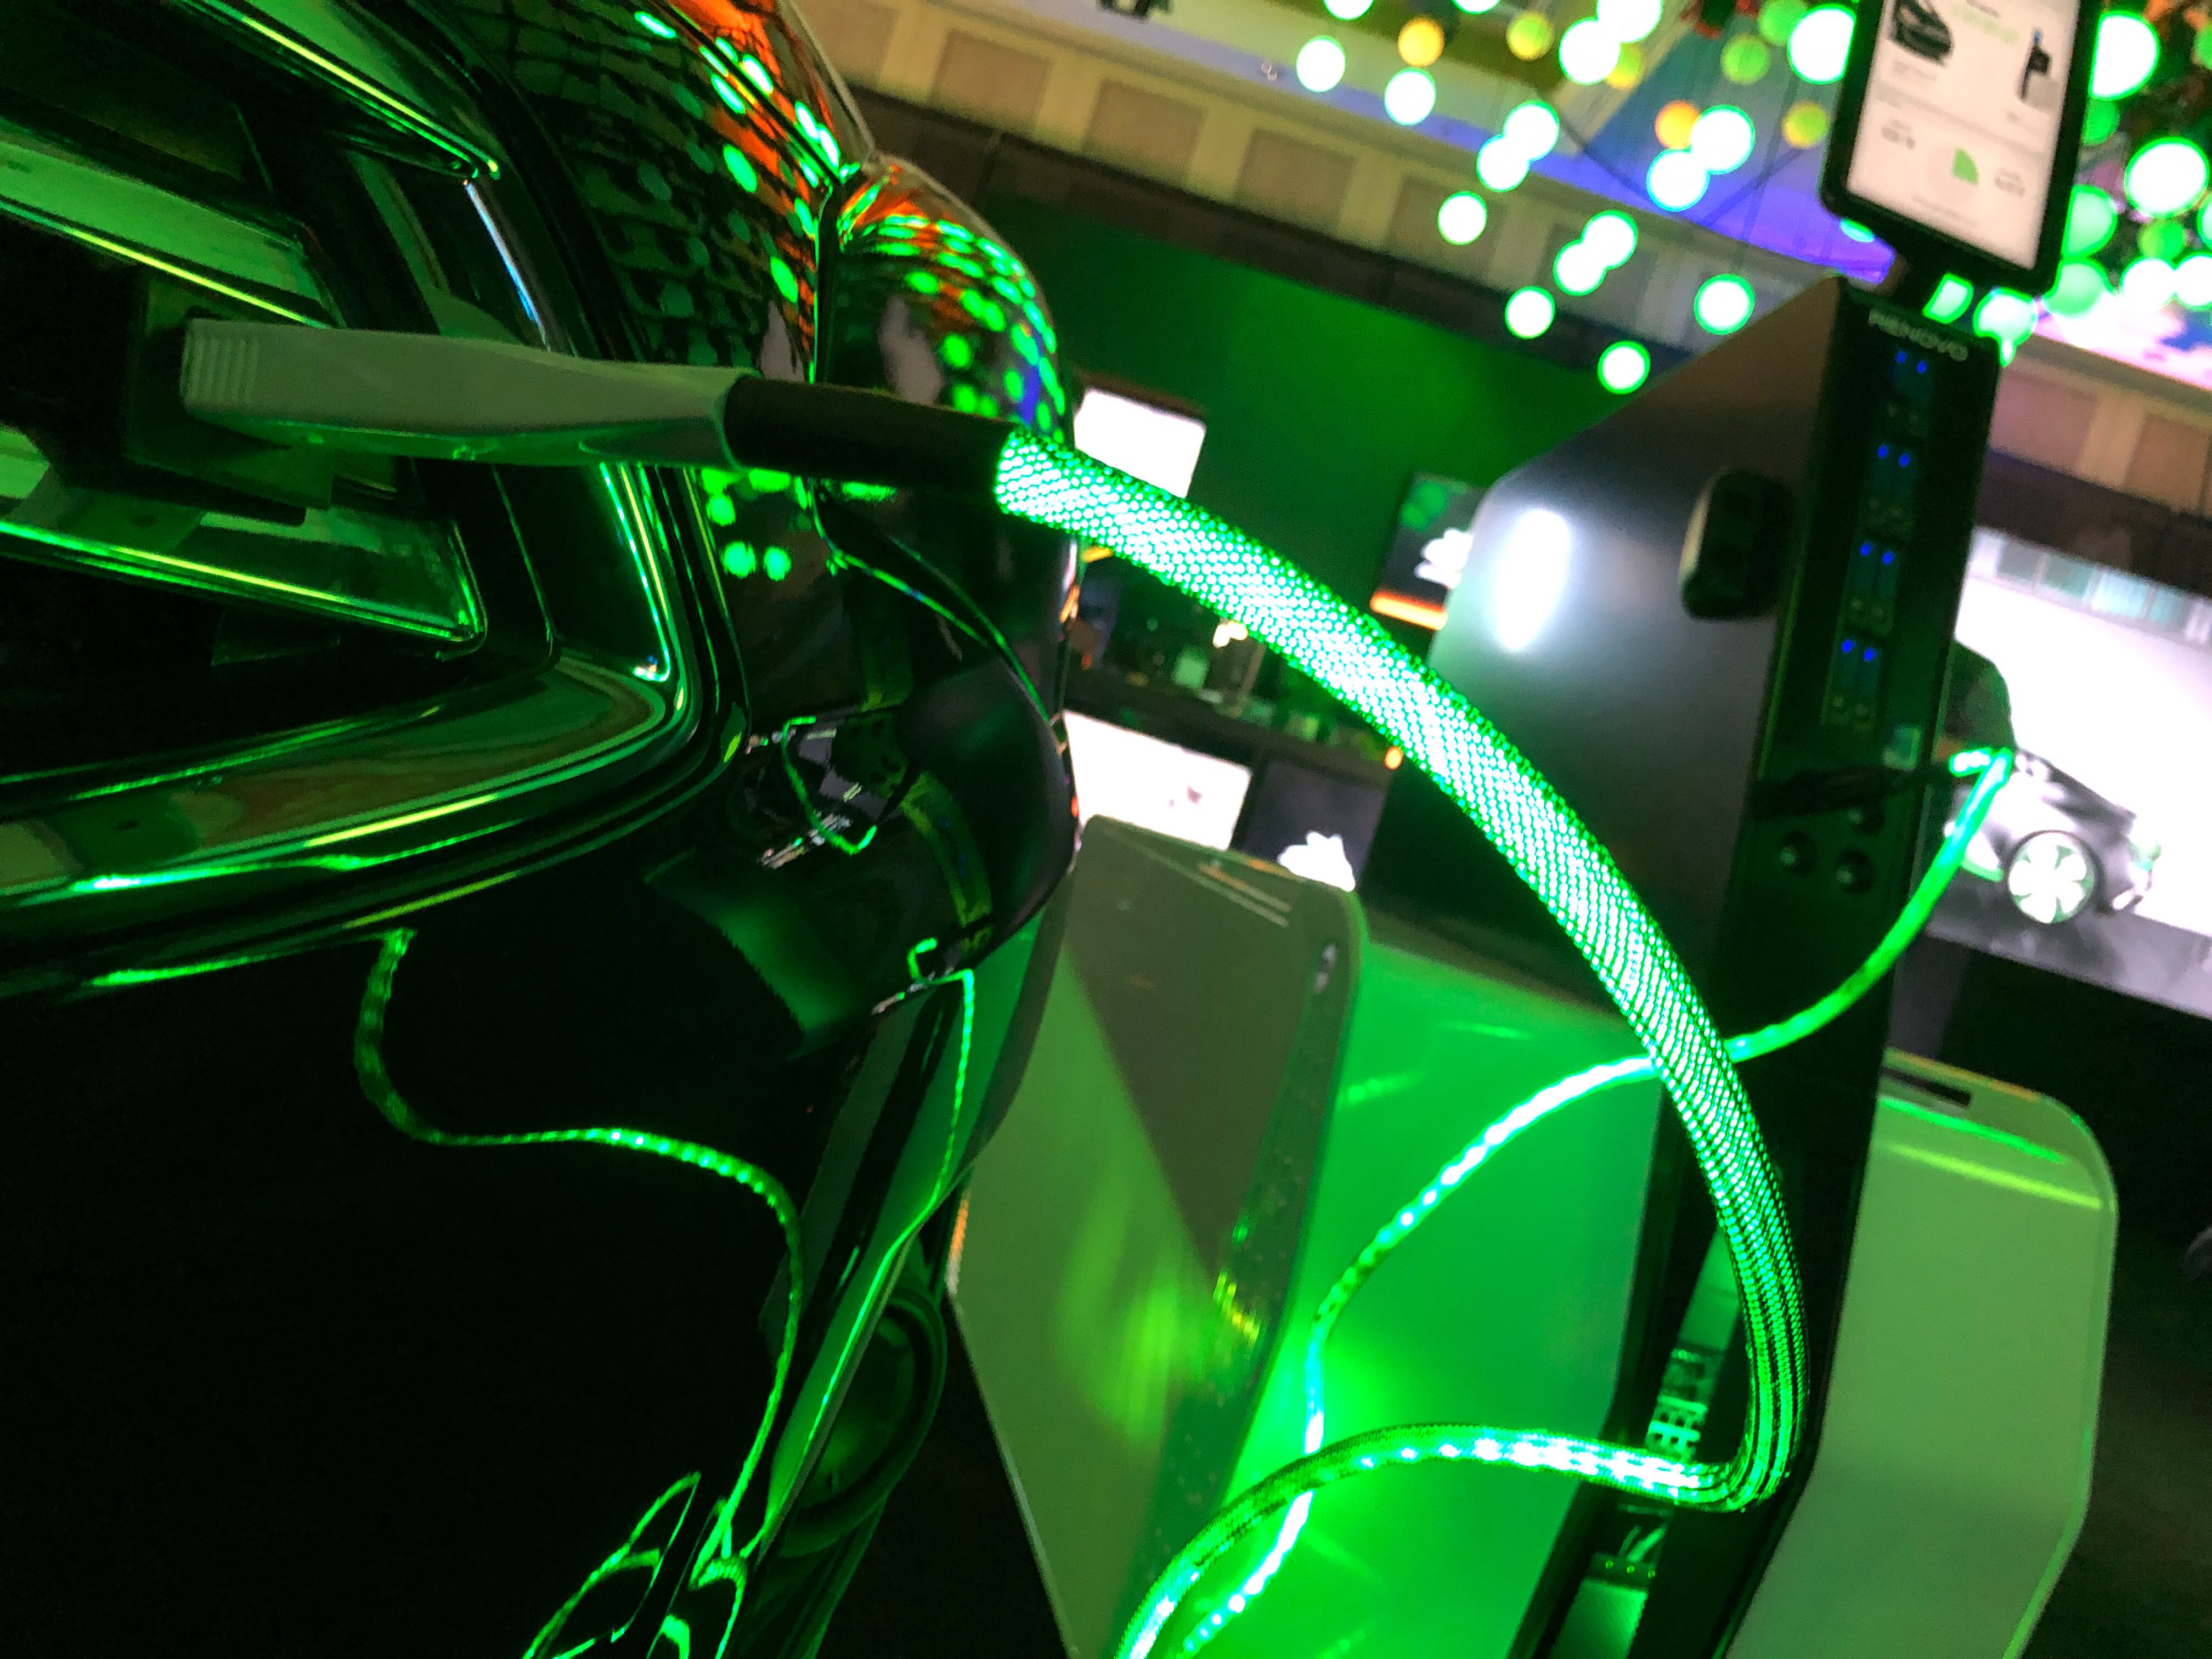
Node LED Data Cable
Nodes on site at Blackberry and Seagate booths:

Renovo Node at Blackberry
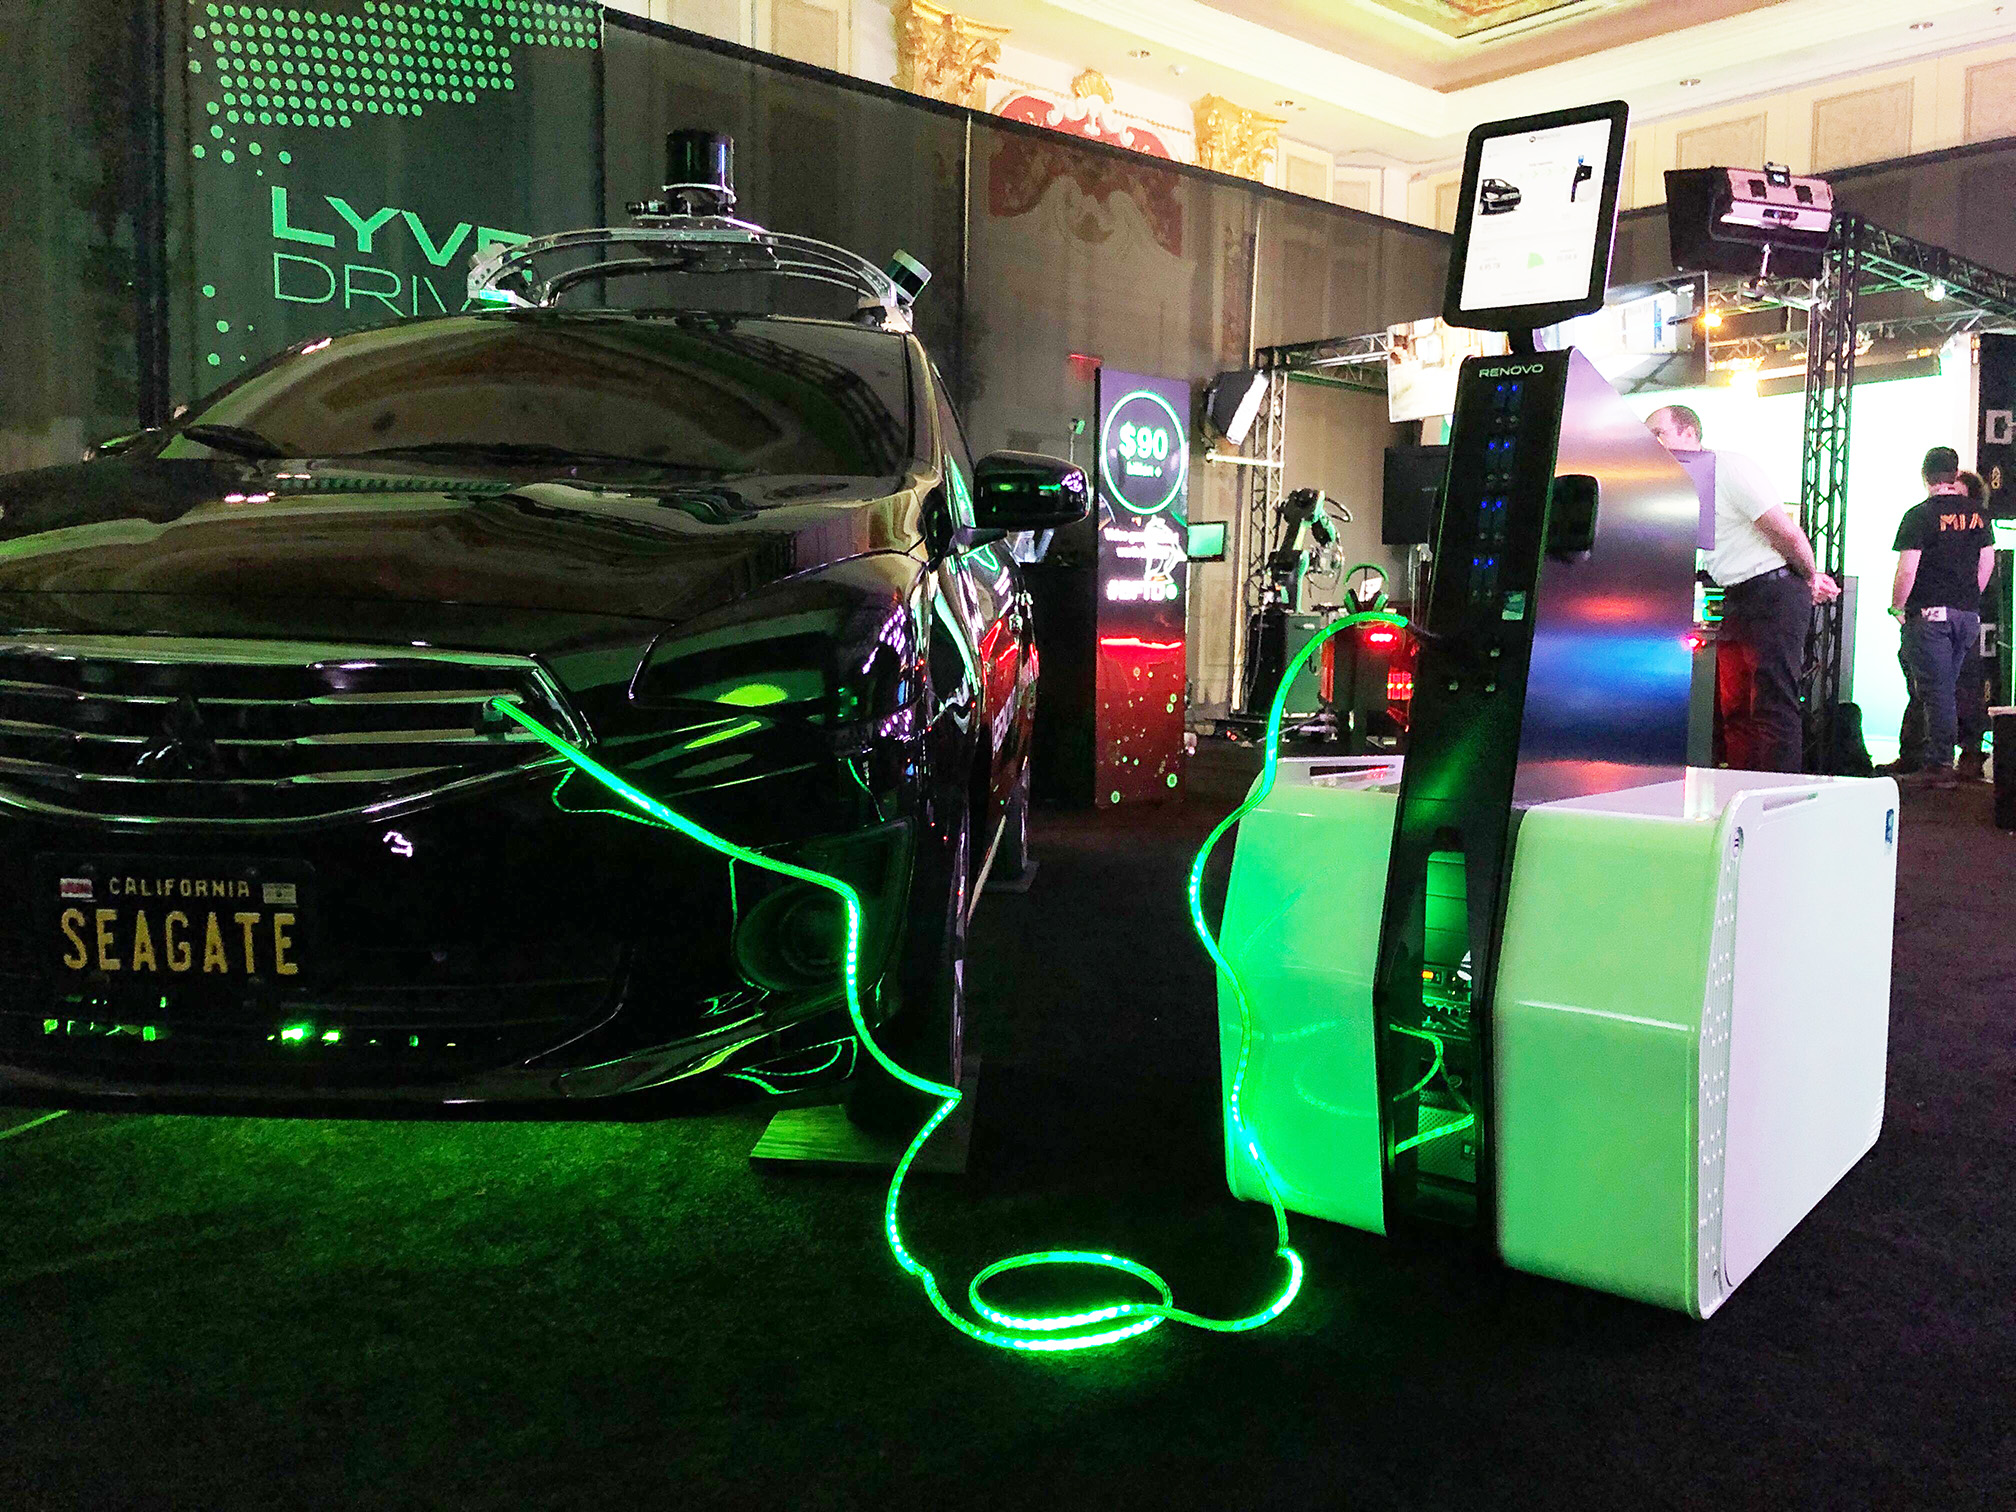
Renovo Node at Seagate
The appearance of our Nodes at CES generated a substantial amount of interest and recognition for both the devices and Renovo. In actual field use, we'll need to verify the efficacy of the display with real world operators. But at the end of the show, it was gratifying to hear that the Node was the most photographed piece of hardware in the Seagate booth.